Exploration
Loading required packages and cleaned data.
#load required packages
library(tidyverse)
── Attaching core tidyverse packages ──────────────────────── tidyverse 2.0.0 ──
✔ dplyr     1.1.0     ✔ readr     2.1.4
✔ forcats   1.0.0     ✔ stringr   1.5.0
✔ ggplot2   3.4.1     ✔ tibble    3.1.8
✔ lubridate 1.9.2     ✔ tidyr     1.3.0
✔ purrr     1.0.1
── Conflicts ────────────────────────────────────────── tidyverse_conflicts() ──
✖ dplyr::filter() masks stats::filter()
✖ dplyr::lag()    masks stats::lag()
ℹ Use the conflicted package (<http://conflicted.r-lib.org/>) to force all conflicts to become errors
here() starts at C:/Users/Katie/Documents/2022-2023/MADA/katiewells-MADA-portfolio
#load data
flu2 <- readRDS(here("fluanalysis", "data", "flu2.rds"))
Summary statistics for BodyTemp and Nausea
#provide summary data for important variables
flu2 %>% pull(Nausea) %>% summary()
flu2 %>% pull(BodyTemp) %>% summary()
   Min. 1st Qu.  Median    Mean 3rd Qu.    Max.
  97.20   98.20   98.50   98.94   99.30  103.10
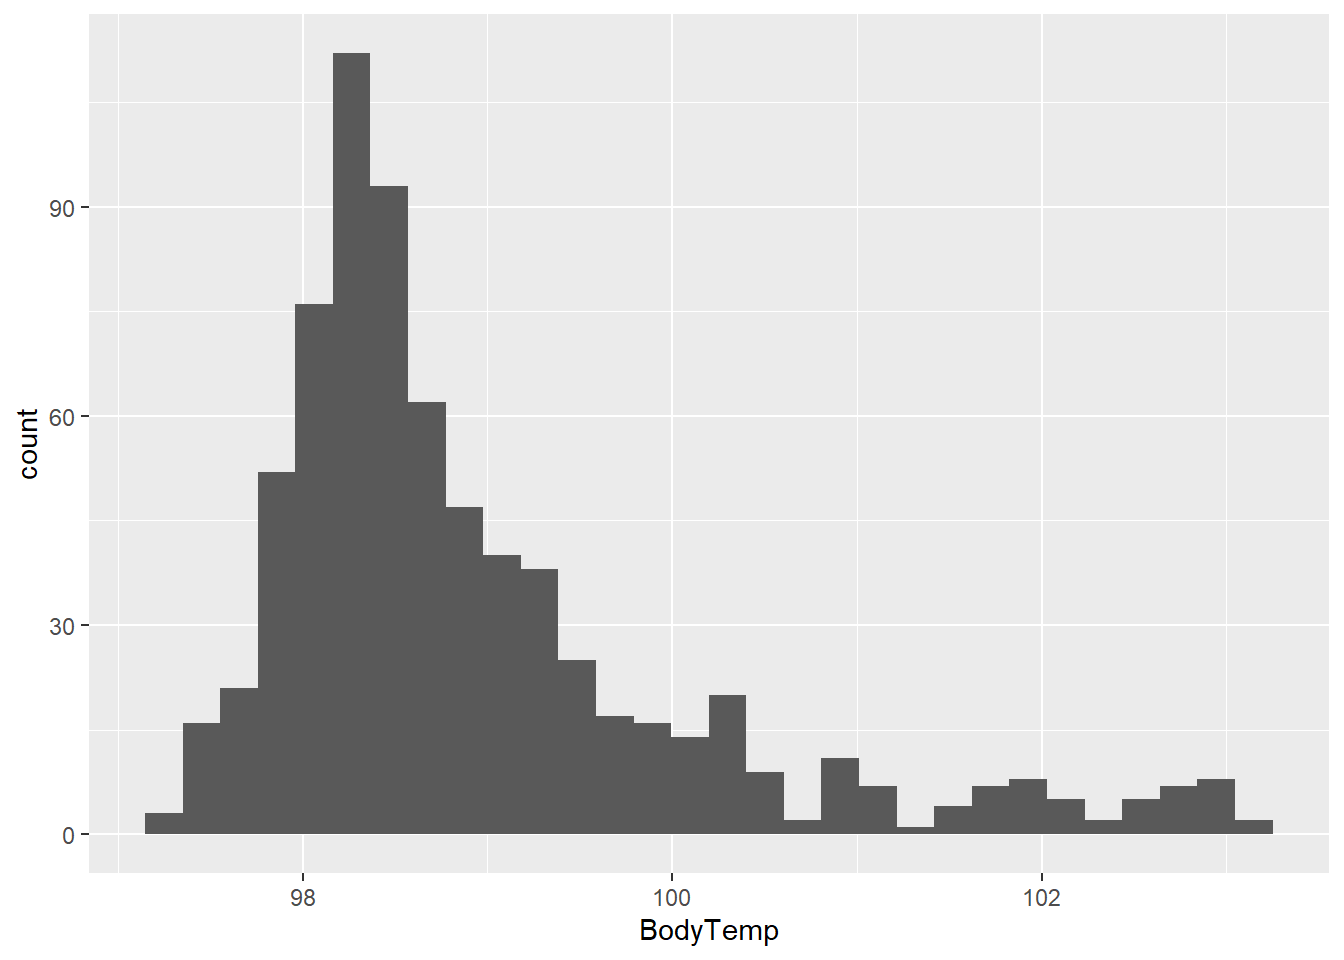
Distribution of BodyTemp
#look at the distribution of BodyTemp
flu2 %>% ggplot(aes(x=BodyTemp)) + geom_histogram()
`stat_bin()` using `bins = 30`. Pick better value with `binwidth`.
Looks like of the body temperatures cluster around 98.5 degrees with some right skew.
Lets take a look ath the relationship between BodyTemp and some predictors.
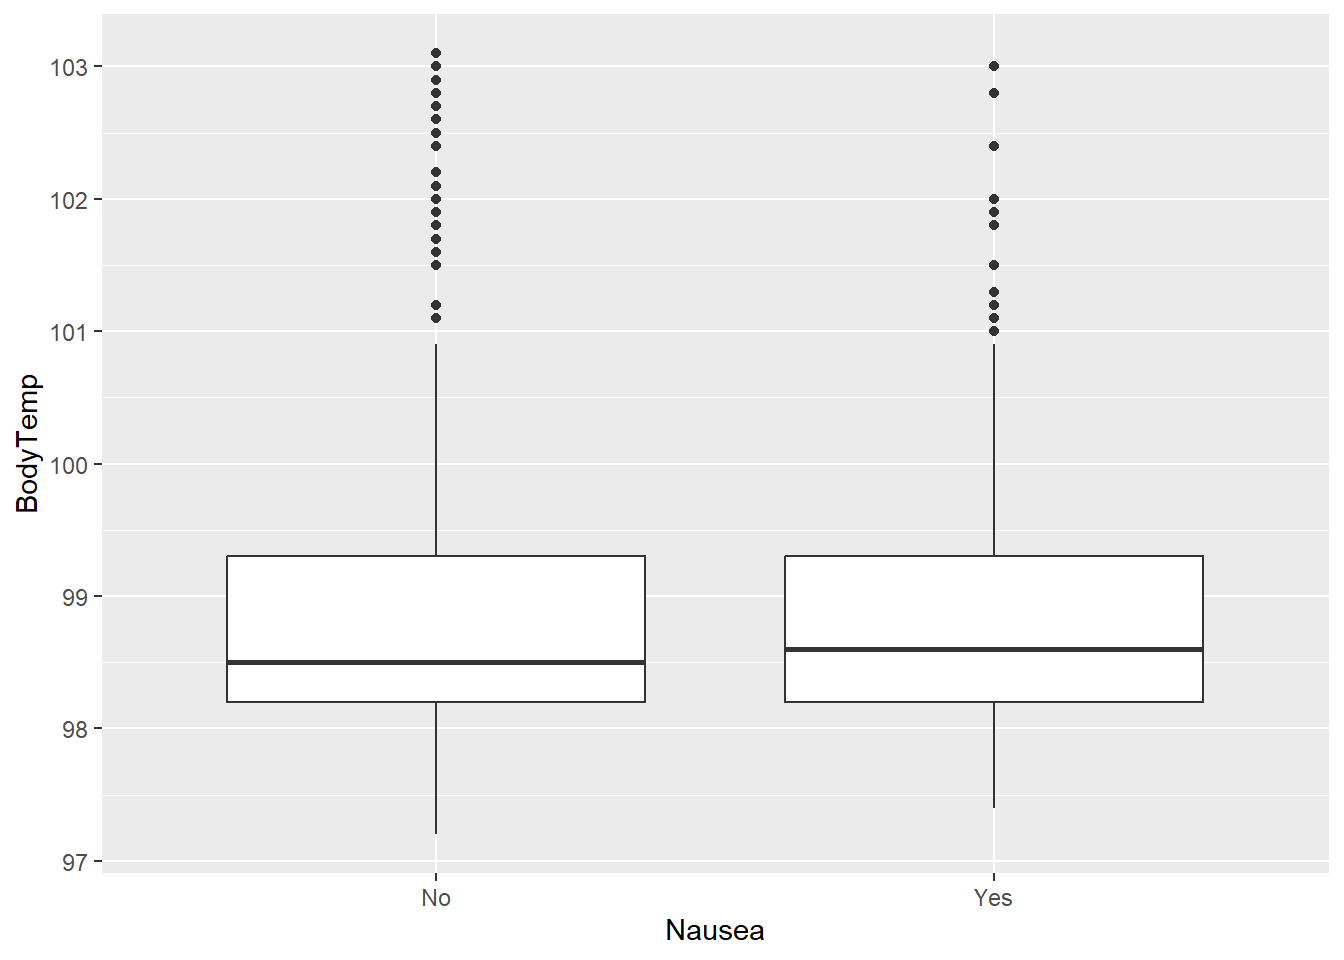
flu2 %>% ggplot(aes(x=Nausea, y=BodyTemp)) + geom_boxplot()
Seems like median body temperature is just slightly higher in those with nausea than without.
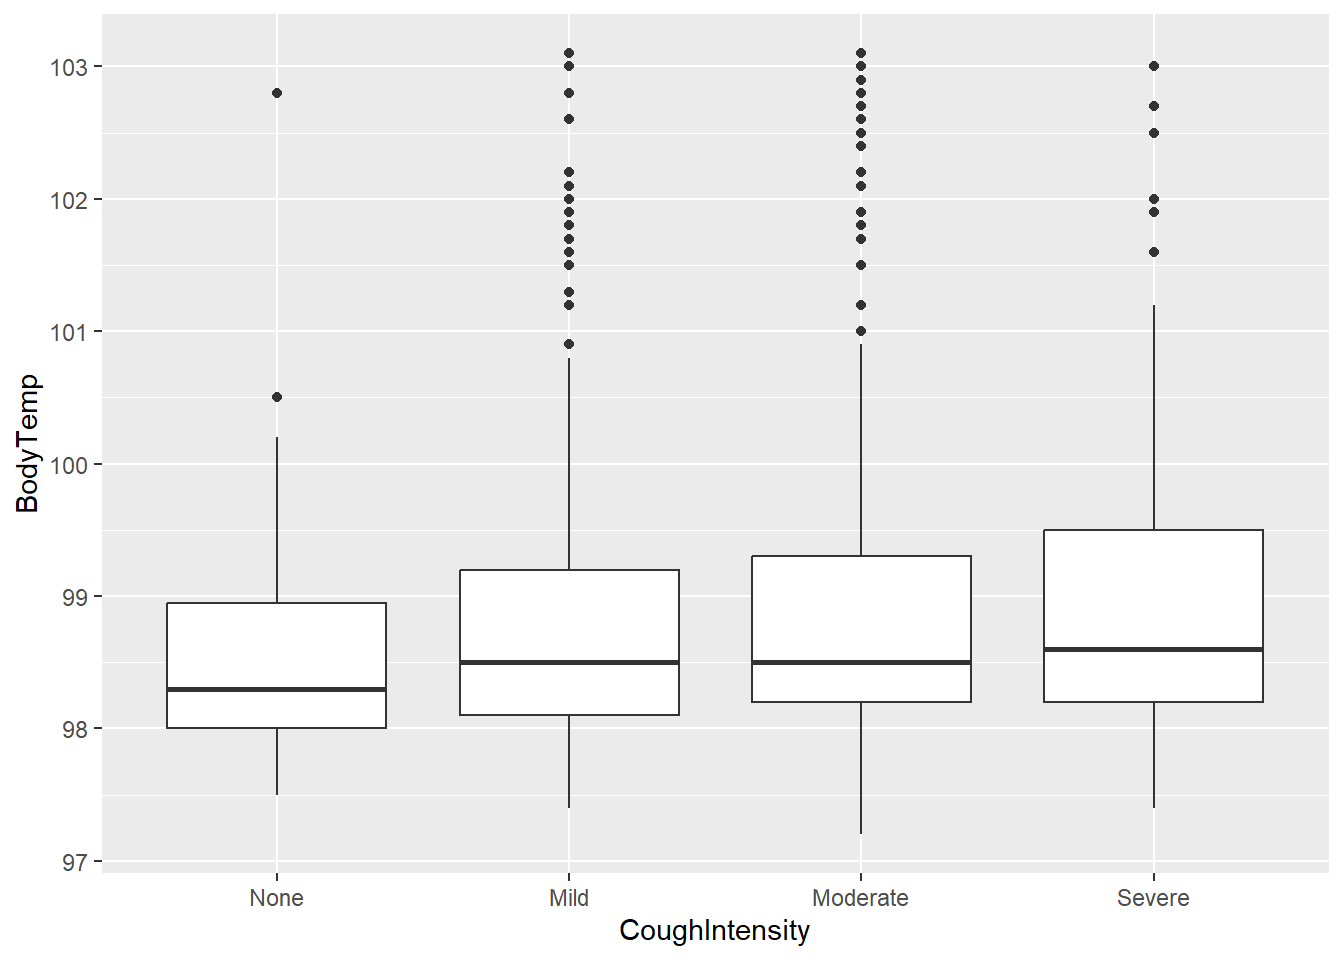
flu2 %>% ggplot(aes(x=CoughIntensity, y=BodyTemp)) + geom_boxplot()
Median body temperature looks to increase as cough intensity increases.
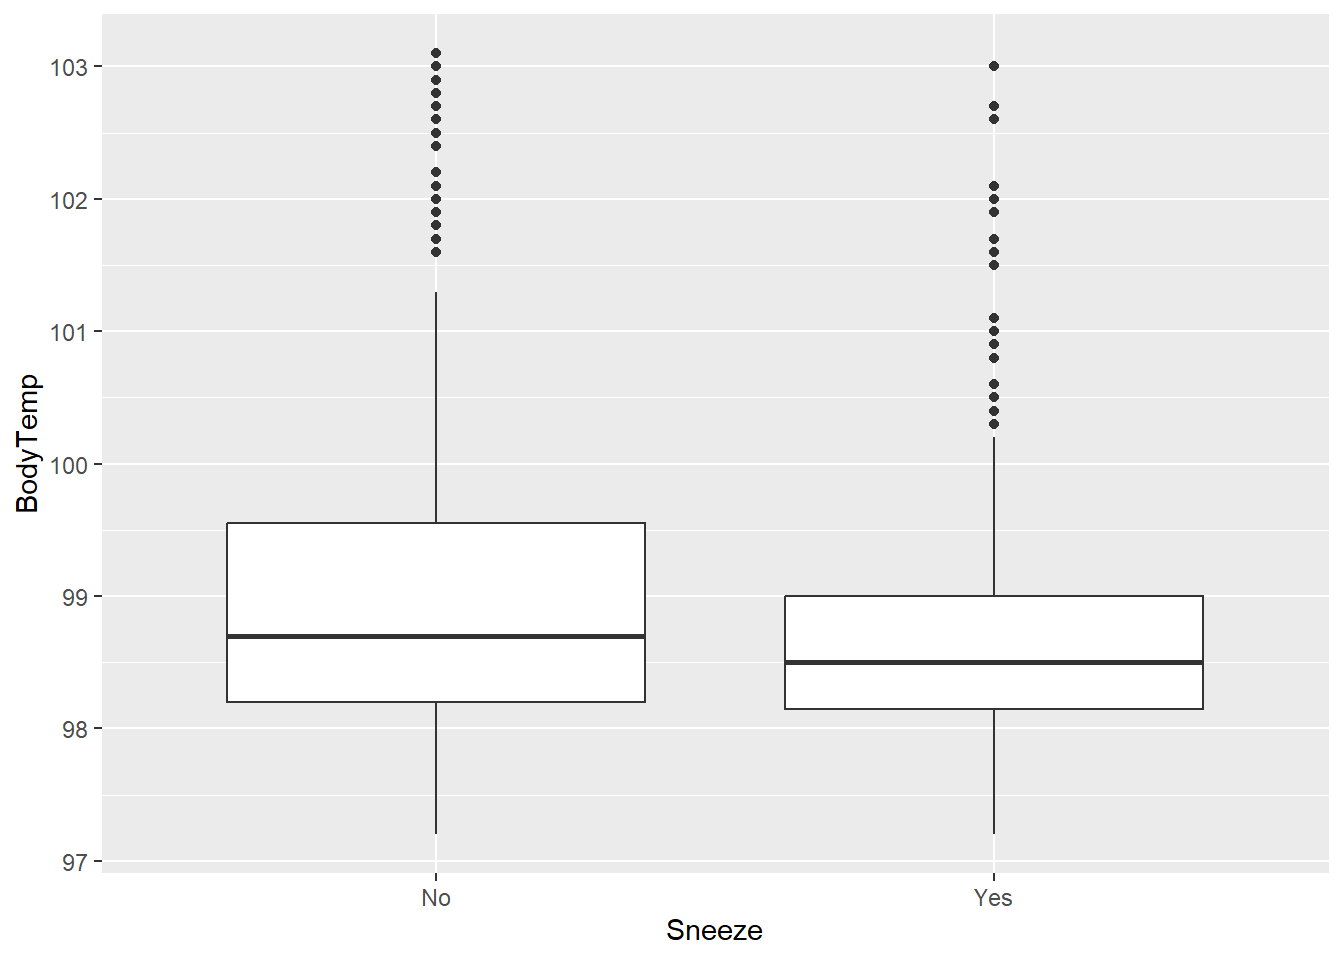
flu2 %>% ggplot(aes(x=Sneeze, y=BodyTemp)) + geom_boxplot()
Looks like people who did not report sneezing have a higher median body temperature. Weird.
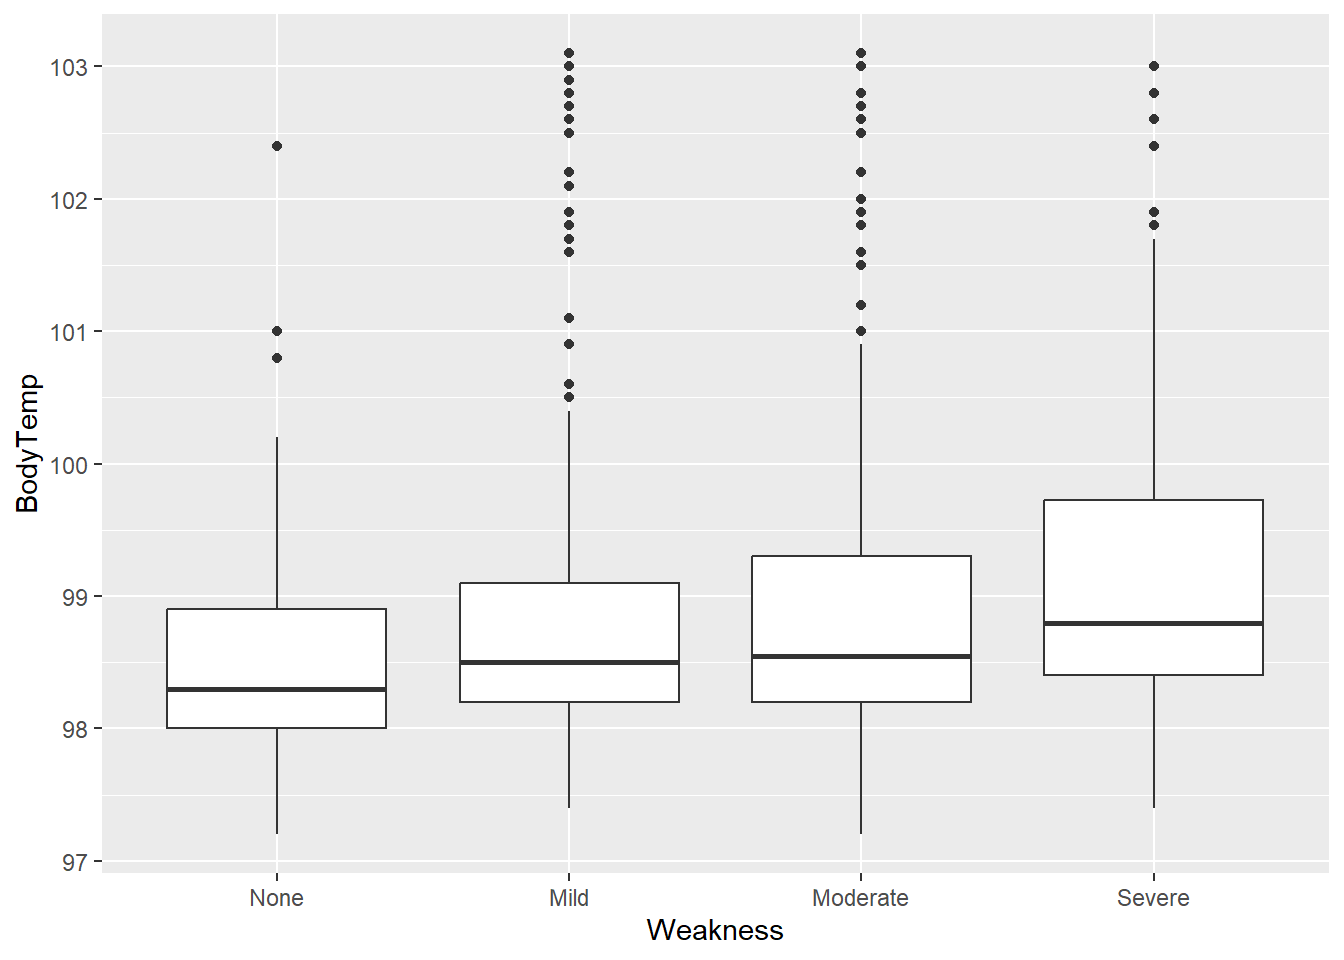
flu2 %>% ggplot(aes(x=Weakness, y=BodyTemp)) + geom_boxplot()
Median body temperature seems to increase as weakness increases.