Here’s my contribution to the Tidy Tuesday analysis for the 2/14/23 dataset Hollywood Age Gaps. This data was taken from Hollywood Age Gap via https://www.data-is-plural.com/archive/2018-02-07-edition/. It takes a look at the differences between ages in couples in movies. Some things I would like to explore are:
1) the relationship between release year and age differences
2) how actor/character age and gender are related
3) how much the movies deviate from the average age difference
Let’s load the packages I’ll need.
#load packageslibrary(tidyverse)
── Attaching core tidyverse packages ──────────────────────── tidyverse 2.0.0 ──
✔ dplyr     1.1.0     ✔ readr     2.1.4
✔ forcats   1.0.0     ✔ stringr   1.5.0
✔ ggplot2   3.4.1     ✔ tibble    3.1.8
✔ lubridate 1.9.2     ✔ tidyr     1.3.0
✔ purrr     1.0.1
── Conflicts ────────────────────────────────────────── tidyverse_conflicts() ──
✖ dplyr::filter() masks stats::filter()
✖ dplyr::lag()    masks stats::lag()
ℹ Use the conflicted package (<http://conflicted.r-lib.org/>) to force all conflicts to become errors
library(ggplot2)library(plotly)
Attaching package: 'plotly'

The following object is masked from 'package:ggplot2':

    last_plot

The following object is masked from 'package:stats':

    filter

The following object is masked from 'package:graphics':

    layout
Now for the data; let’s load it and take a look at the structure.
Rows: 1155 Columns: 13
── Column specification ────────────────────────────────────────────────────────
Delimiter: ","
chr  (6): movie_name, director, actor_1_name, actor_2_name, character_1_gend...
dbl  (5): release_year, age_difference, couple_number, actor_1_age, actor_2_age
date (2): actor_1_birthdate, actor_2_birthdate

ℹ Use `spec()` to retrieve the full column specification for this data.
ℹ Specify the column types or set `show_col_types = FALSE` to quiet this message.
This data has been relatively cleaned and wrangled already; let’s just get some stats I might be interested in.
age_gaps %>%pull(release_year) %>%range()
[1] 1935 2022
age_gaps %>%pull(actor_1_age) %>%range()
[1] 18 81
age_gaps %>%pull(actor_2_age) %>%range()
[1] 17 68
age_gaps %>%pull(age_difference) %>%range()
[1] 0 52
This gives me the range of release years, actor ages, and age differences for all the movies. Seeing these, let’s plot the release years against age differences and see if any trends appear. Just for fun, let’s make this interactive so we can see which movies fall where. This will let me hover over each dot and see the movie name and age difference. I can do this with plotly.
plot <- age_gaps %>%ggplot(aes(x=release_year, y=age_difference)) +geom_point() +geom_smooth(method ="lm") +labs(title="Age Gaps in Movies through the Years", x="Year", y="Age Difference")ggplotly(plot)
`geom_smooth()` using formula = 'y ~ x'
Well…there seems to be a slight negative correlation between release year and age difference, but more movies have been released in recent years which is likely skewing the data. The interactive portion provided by plotly() makes it very easy to see the movie with the largest age difference (52 years) was released in 1971.
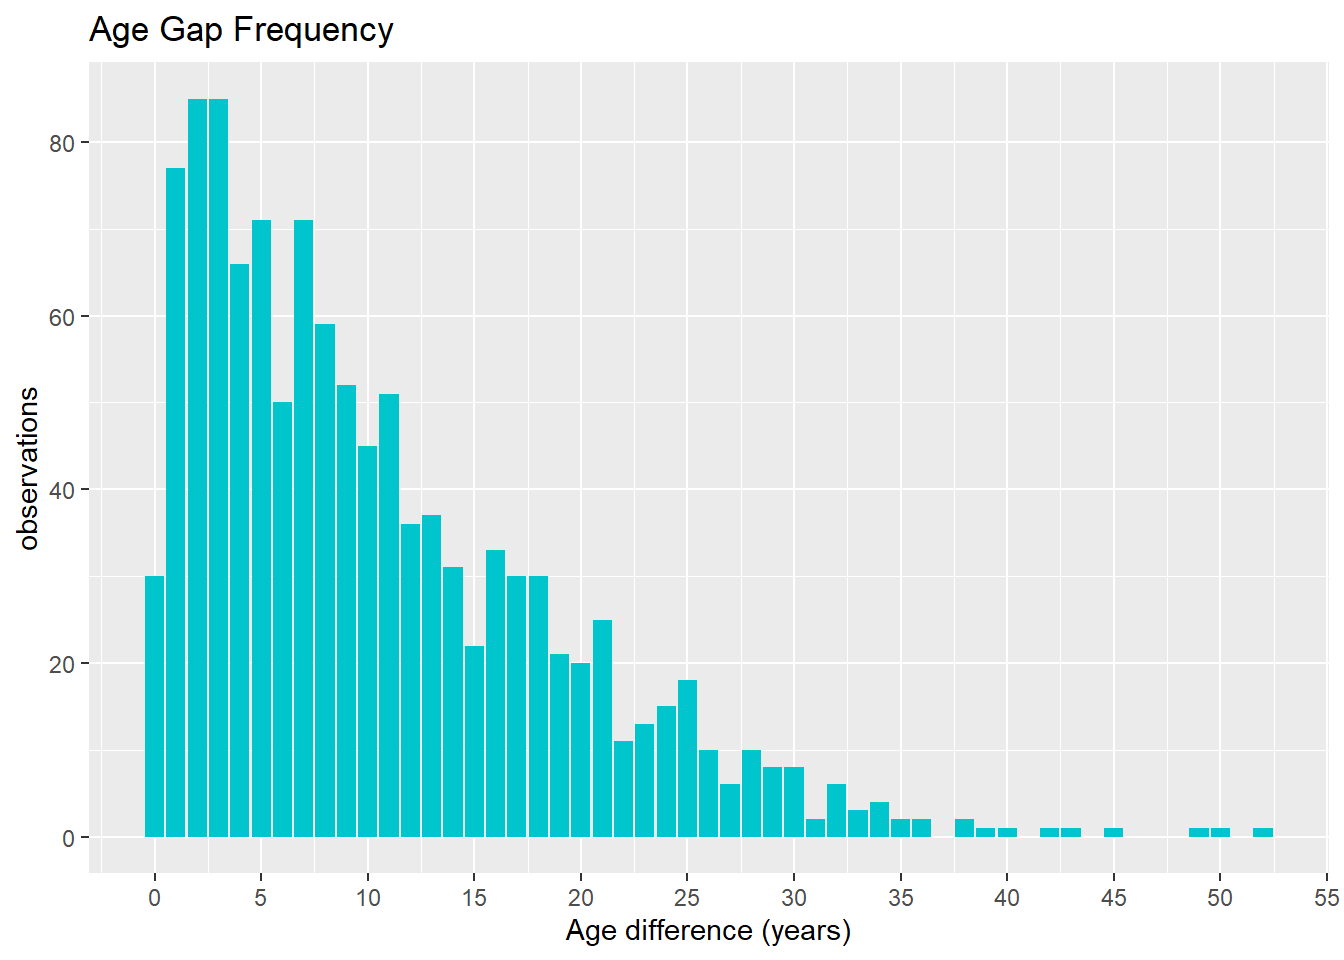
Let’s look at the frequency of age differences with a bar graph.
Looks like 2 and 3 years is the most popular age gap in these movies.
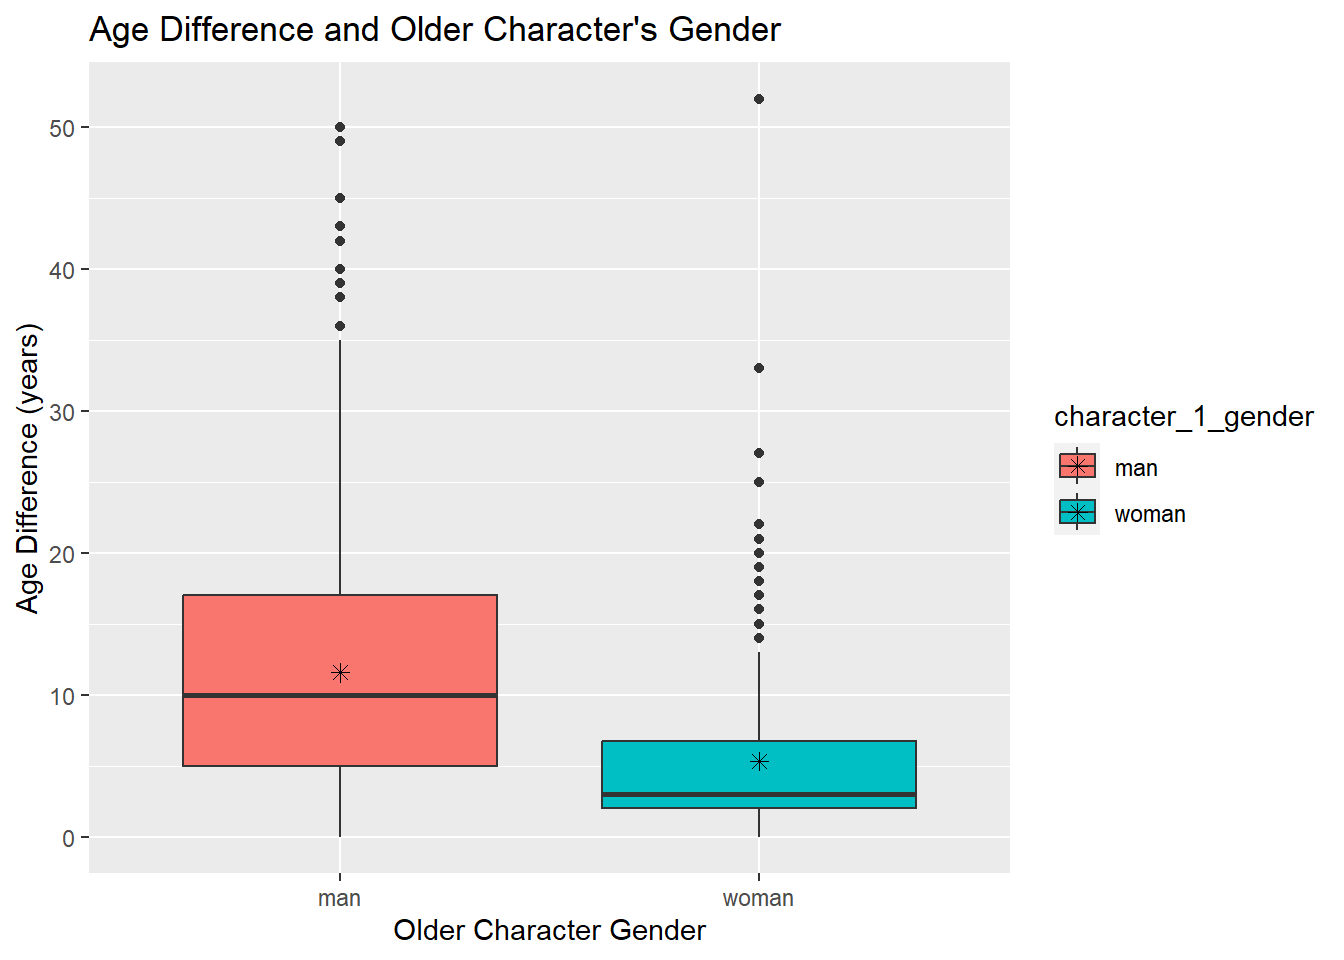
After examining the data further, I noticed that actor 1 (and therefore character 1) was always the older of the couple. I want to see the distribution of age difference based on whether the older character is male or female. I think a boxplot would be a good way to visualize this information.
#make a boxplot of character 1 gender vs. age differenceage_gaps %>%ggplot(aes(x=character_1_gender, y=age_difference, fill=character_1_gender)) +geom_boxplot() +stat_summary(fun ="mean", geom ="point", shape =8, size =2, color ="black") +labs(x="Older Character Gender", y="Age Difference (years)") +ggtitle("Age Difference and Older Character's Gender")
This tells us there are many more movies where the older character is male and that the mean and median age difference is higher in those movies. The one very obvious outlier of Harold and Maude on the older female character side is visible here.
Let’s see how a random sample of movies compares to the average age difference of this dataset.
#calculate the mean age differenceage_gaps %>%pull(age_difference) %>%mean()
[1] 10.42424
#take a (fixed) random sample (so y'all can reproduce if you want)set.seed(20)rand_age <- age_gaps %>%sample_n(size=20)
#make a new column with the z score (normalized age difference)rand_age <- rand_age %>%mutate(diff_z =round((age_difference -mean(age_difference))/sd(age_difference), 2)) #make a new column telling whether each movie is above or below the averagerand_age <- rand_age %>%mutate(diff_v =ifelse(diff_z <0, "below", "above"))
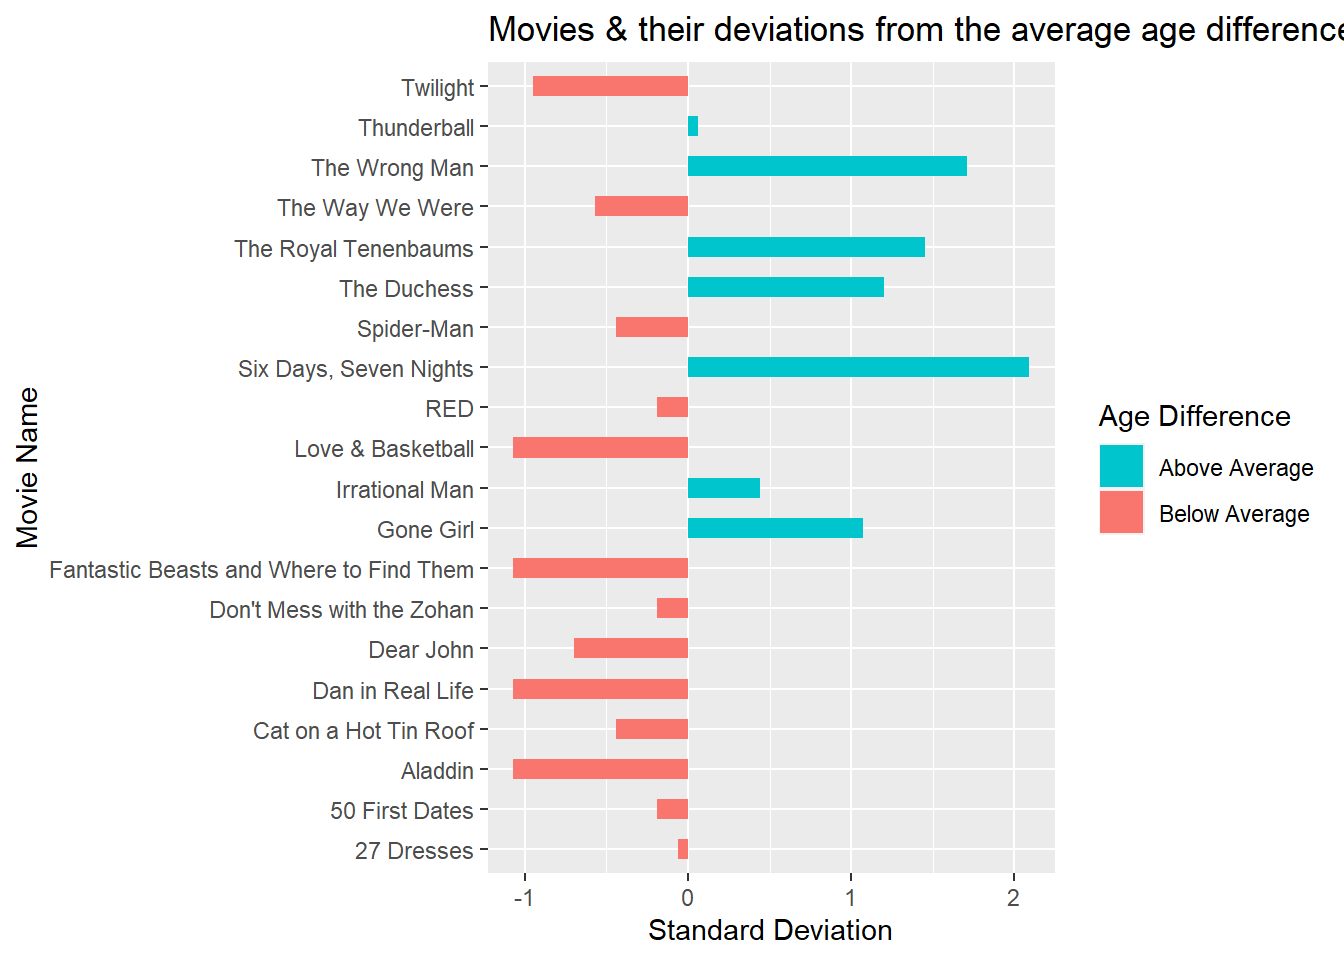
I wanted a way to show how different these movies were from each other (and the average) in terms of age difference, and a StackOverflow post gave me the idea to do a diverging bar graph.
#graph a diverging bar plot showing how many standard deviations each movie is away from the meanggplot(rand_age, aes(x=movie_name, y=diff_z, label=diff_z)) +geom_bar(stat='identity', aes(fill=diff_v), width=.5) +scale_fill_manual(name="Age Difference", labels =c("Above Average", "Below Average"), values =c("above"="#00C5CD", "below"="#f8766d")) +labs(title="Movies & their deviations from the average age difference", x="Movie Name", y="Standard Deviation") +coord_flip()
Seems like most of the movies in this random sample fall below the average of 10.42424 years between the actors.
Just for fun, let’s see how many movies in the whole dataset are above or below the average. There’s no way to be able to see all of them in a graph like the one above so let’s just look at the numbers.
#make a new column with the z score (normalized age difference)age_gaps <- age_gaps %>%mutate(diff_z =round((age_difference -mean(age_difference))/sd(age_difference), 2)) #make a new column telling whether each movie is above or below the averageage_gaps <- age_gaps %>%mutate(diff_v =ifelse(diff_z <0, "below", "above"))#get counts of above and below the averageage_gaps %>%pull(diff_v) %>%table()
.
above below
  464   691
Looks like a 60/40 split.
Overall it looks like: age gaps have decreased over the years (but movie release has increased), 2-3 years is the most common age gap, men are usually the older actor/character, and only around 40% of movies in this dataset have an above average age difference.